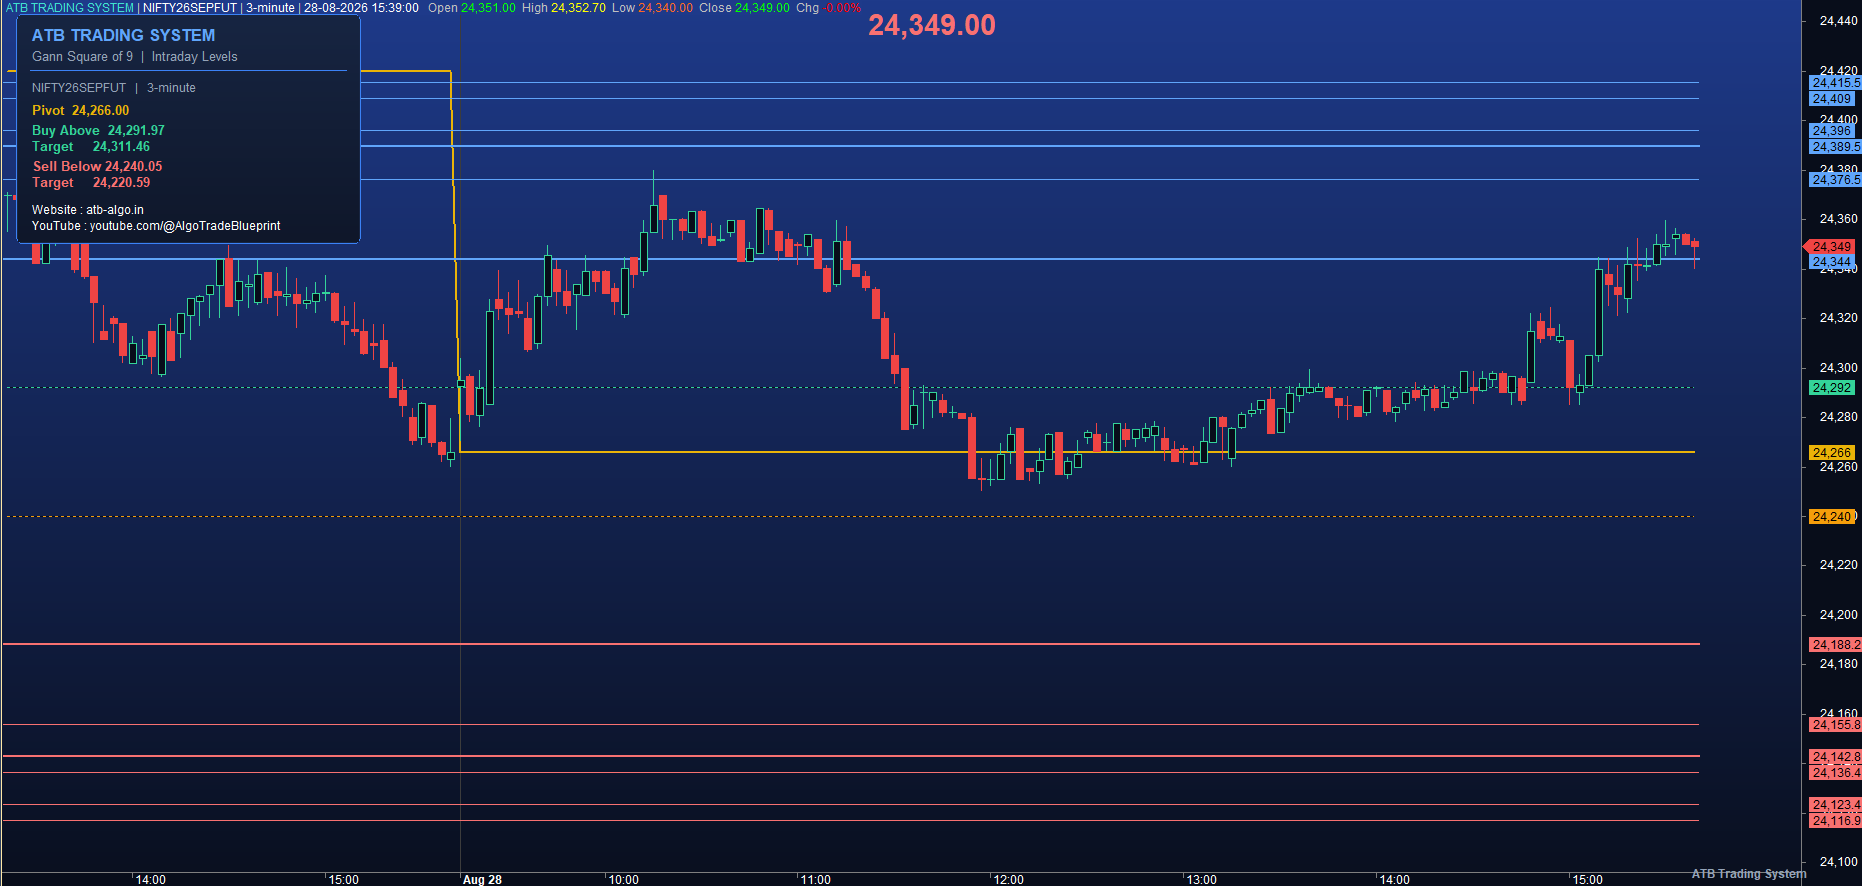
The ATB Trading System Gann Square of 9 is a professional-grade technical analysis tool for AmiBroker that applies the classic Gann Square of 9 price-rotation method to intraday trading. By rotating the square root of price in fixed angular steps (1/48th of 360 degrees), the system derives a full set of support and resistance levels above and below the daily pivot, plus tighter buy and sell zones for entries.
How It Works
- The system takes the daily pivot (average of the day’s high and low, or the prior close).
- It rotates the square root of that price in 1/48th-of-360-degree steps to build resistance (H1-H6) and support (L1-L6) levels.
- Smaller steps create the buy zone (B1-B5) above the pivot and the sell zone (S1-S5) below it.
- A breakout scanner flags price crossing above the buy level (B3) or below the sell level (S3).
Entry & Exit Signals
- A green Buy signal appears when price crosses above the buy zone level (B3).
- A red Sell signal appears when price crosses below the sell zone level (S3).
- The pivot line and on-chart labels show the key levels at a glance.
- The info panel displays the pivot, buy-above, sell-below and target levels.
Settings Explained
- EOD toggle: use the prior day’s close or the current day’s pivot as the base.
- Show Resistance / Support / Buy-Sell toggles control which levels are plotted.
- Show Level Labels toggles the on-chart text labels.
- Panel X/Y/Width/Height position the info panel.
Best Timeframes & Symbols
- Works on any intraday timeframe (1-15 min) for liquid stocks, indices and futures.
- Best on high-liquidity instruments like Nifty, Bank Nifty and major blue-chips.
How to Install in AmiBroker
- Open AmiBroker, right-click the Custom folder and select New → Formula.
- Paste the AFL code, save, and drag the formula onto an open chart.
- Use Parameters to toggle levels, labels and the info panel.
Pro Tips
- Use the buy/sell zones as entry triggers and the H/L levels as targets or stops.
- Combine with the daily pivot for a clean intraday framework.
FAQ
- Does it repaint? No — levels are derived from the daily pivot and stay fixed for the day.
- Can I use it for scanning? Yes — the built-in scanner flags buy/sell crosses across your watchlist.
Educational purposes only — not financial advice. Trading involves substantial risk of loss. Test on demo data before live use.